Analysis & Insights: Visualizing Trends and Behavioral Patterns
The Analysis section transforms your journal entries into actionable insights, revealing patterns, trends, and correlations that help you understand what's working for your child and what needs attention.
Weekly Insights Reports
VillageMetrics automatically generates personalized weekly insights reports that synthesize your child's behavior patterns over the past week. These AI-powered reports analyze your journal entries and behavior data to surface patterns, successful strategies, and areas for attention.
How It Works
Automatic Generation:
- Reports are generated weekly and delivered directly to your app feed
- You'll receive a notification when new insights are ready
- All village members can view the insights report
What's Included:
- Overview of the week's behavioral patterns
- Key insights highlighting what worked well
- Challenges observed during the week
- Progress trends compared to your child's typical patterns
- Suggested questions for deeper exploration using Ask Anything
Getting Started:
- Weekly insights become available once you have sufficient journal data
- The system builds a comprehensive understanding of your child's typical patterns
- Reports become more personalized and accurate over time as more data is collected
Viewing Insights Reports
In Your Feed:
- Weekly insights appear as special feed entries
- Tap to view the full professionally-styled report
- Reports include visual elements and organized sections for easy reading
Suggested Questions:
- Each report includes AI-generated follow-up questions
- Questions are tailored to that week's specific patterns and findings
- Tap any question to explore it further with Ask Anything
Proactive Insights
VillageMetrics continuously monitors your child's behavior patterns and proactively alerts you when something significant changes—so you don't have to wait for the weekly report to notice important trends.
How It Works
Automatic Monitoring:
- The system checks behavior score patterns hourly
- Alerts are triggered when behavior scores change by 20% or more over the past 7 days compared to the prior period
- Both improvements and declines trigger alerts, with appropriate tone (celebratory for improvement, supportive for decline)
What's Included:
- Clear notification that behavior has improved or declined significantly
- The percentage change and time period analyzed
- Observations about what may have contributed to the change (activities, events, strategies, or circumstances during the period)
- All observations are framed as correlations worth exploring—not proven causes
Delivery:
- Proactive insights appear in your app feed
- Push notifications alert all village members
- Designed to prompt timely investigation and action
Using Proactive Insights
When You Receive an Improvement Alert:
- Review the observations to understand what might be working
- Consider whether these factors can be replicated or increased
- Share successful strategies with the whole village
When You Receive a Decline Alert:
- Don't panic—this is meant to help you investigate early
- Review the observations for potential contributing factors
- Consider whether temporary circumstances (illness, schedule changes) may explain the decline
- Use Ask Anything for deeper exploration if needed
Accessing Analysis
Minimum Data Requirement
5-Day Threshold: You need at least 5 days of journal entries before the Analysis section becomes available.
Why This Requirement:
- Ensures sufficient data for meaningful pattern recognition
- Prevents analysis based on too few data points
- Allows AI to identify genuine trends vs. random variations
Building to 5 Days:
- Each day with at least one journal entry counts toward the requirement
- Multiple entries per day still count as one day
- Entries from different village members all contribute
- Progress tracker shows how many more days needed
Analysis Improves Over Time
- Week 1: Basic patterns start to emerge
- Month 1: Meaningful trends and correlations become clear
- 3+ Months: Comprehensive insights with seasonal and developmental patterns
- 6+ Months: Rich historical data enables sophisticated longitudinal analysis
Analysis Structure
Time Period Selection
Choose your analysis timeframe to focus on relevant patterns:
Available Periods:
- 7 Days: Recent patterns and immediate trends
- 30 Days: Monthly overview (default selection)
- 3 Months: Quarterly patterns and medium-term trends
- 6 Months: Long-term patterns and developmental changes
Selecting Time Periods:
- Dropdown menu available on all analysis tabs
- Changes apply across all analysis sections
- Consider your goals: recent changes vs. long-term patterns
Analysis Tabs
The analysis is organized into focused sections:
- Overview: High-level behavior trends and key factors
- Behavior Goals: Individual goal performance and patterns
- Journal: Entry summaries and filtering by key moments
- Hashtags: Detailed breakdown by category and impact
- Medications: Medication effectiveness and behavior correlation
Overview Analysis
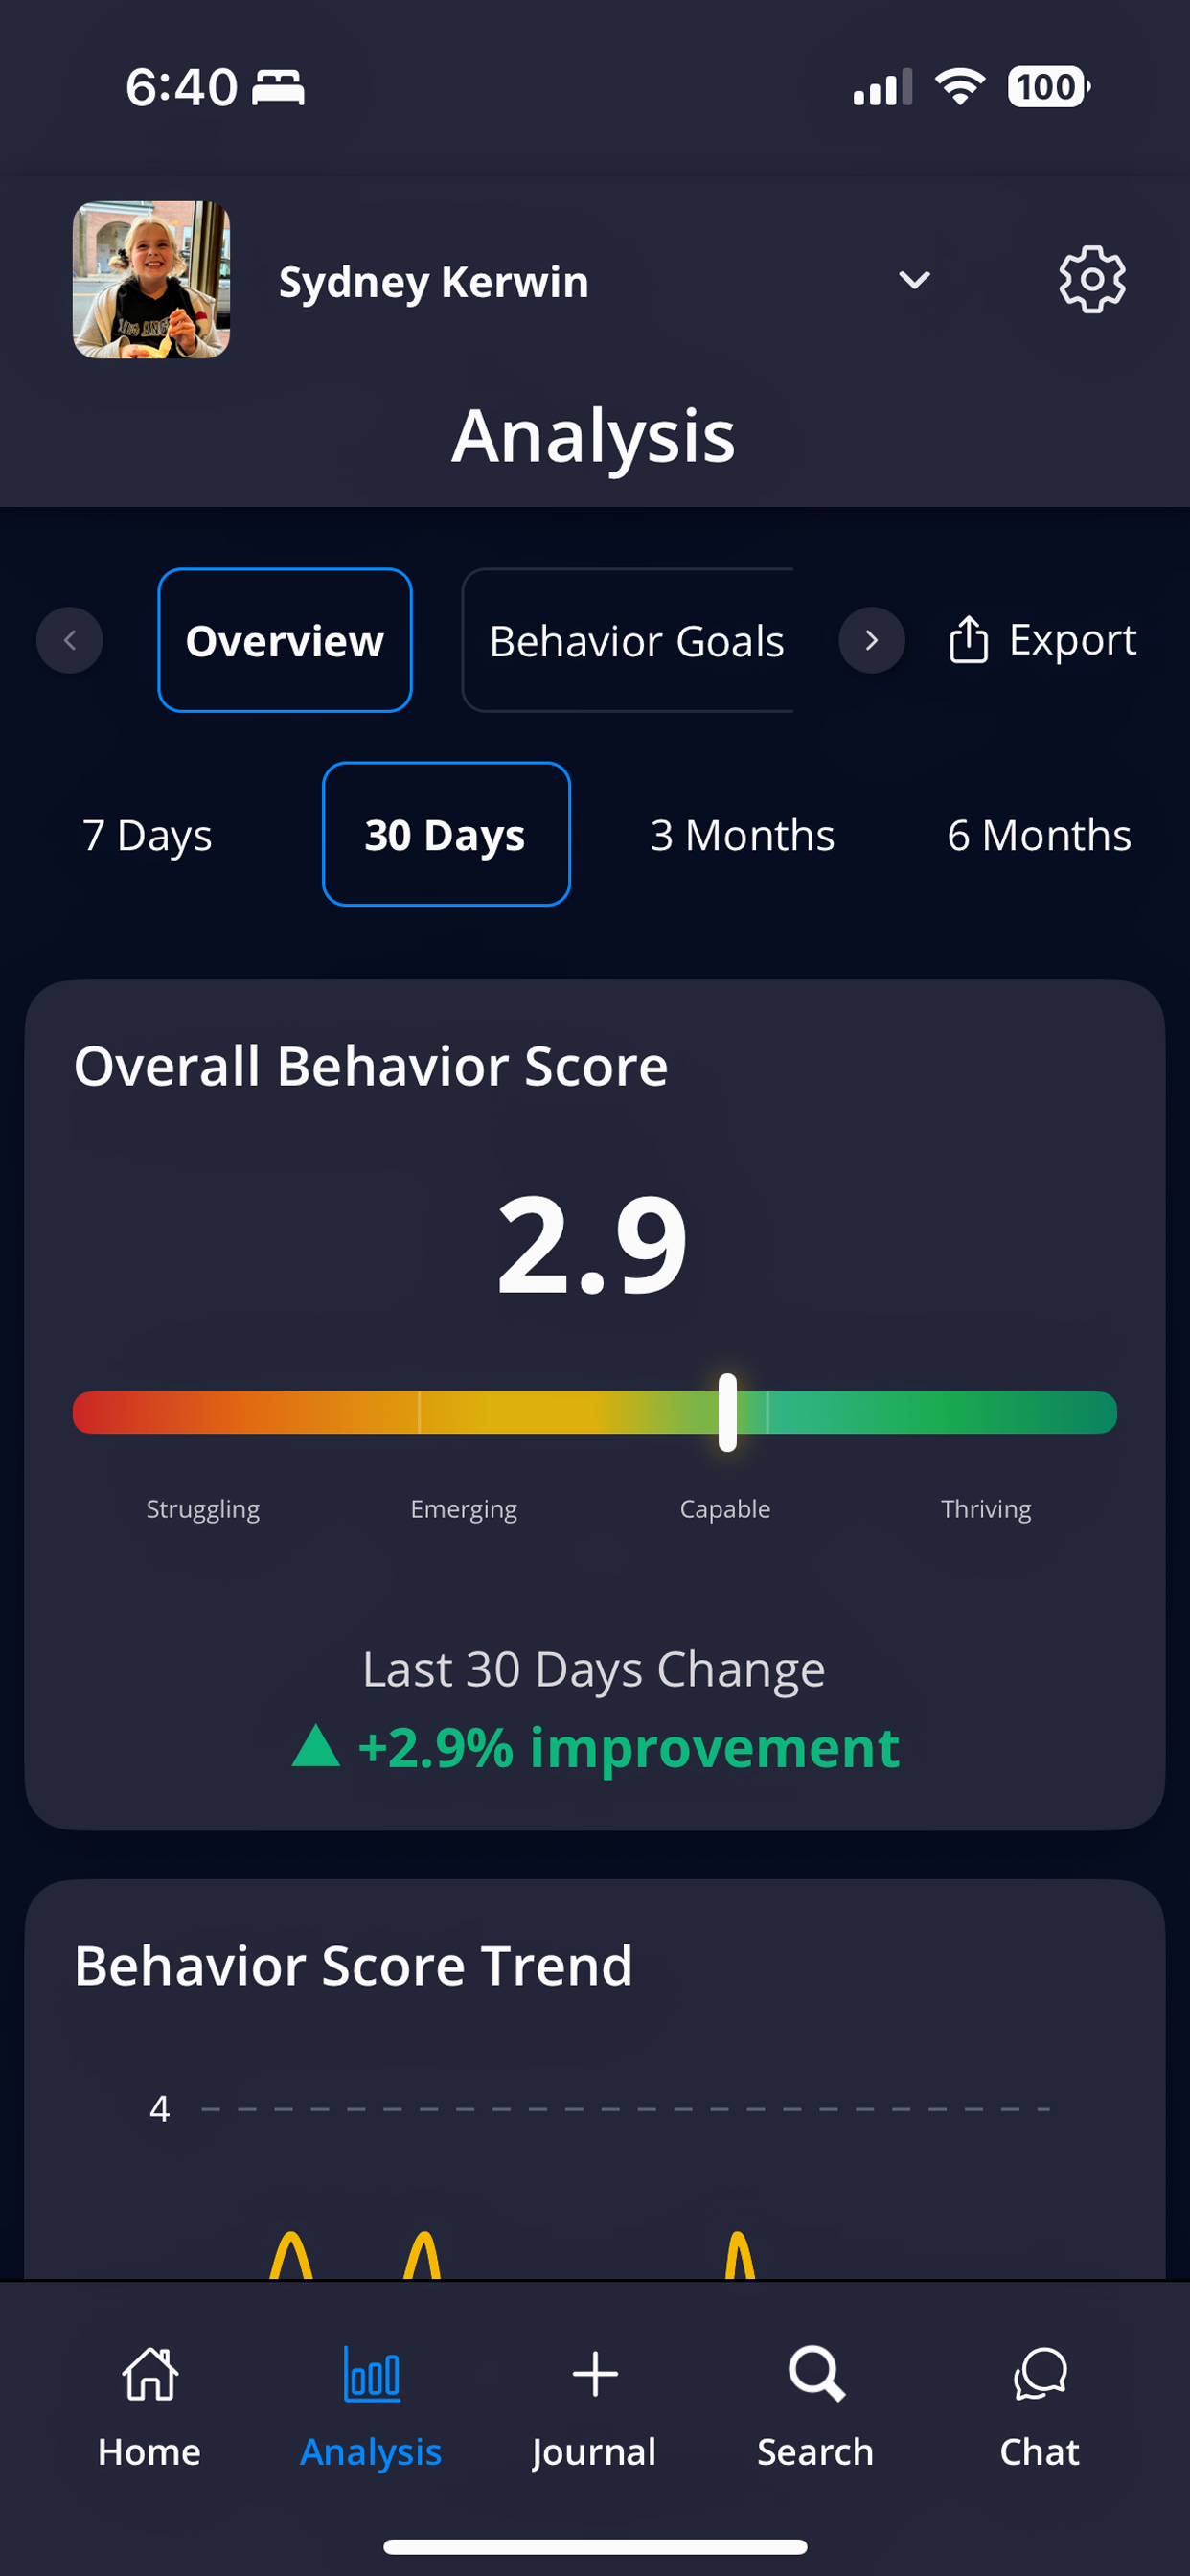
The Overview tab shows overall behavior score, trends over time, and percentage improvement
Overall Behavior Score
What it shows: Average behavior score across all goals for the selected time period
Score Breakdown:
- Struggling (1.0-1.9): Significant challenges requiring intensive support
- Emerging (2.0-2.9): Progress visible but substantial support still needed
- Capable (3.0-3.9): Generally meeting expectations with typical support
- Thriving (4.0): Consistently exceeding expectations with minimal support
Trend Indicator: Shows improvement or decline since the previous equivalent period
- Example: If viewing 30 days, compares to the previous 30 days
- Green arrow up: Improvement
- Red arrow down: Decline
- Percentage shows magnitude of change
Behavior Score Trend Chart
Visual Timeline: Day-by-day behavior scores plotted over the selected time period
How to Read:
- X-axis: Date range
- Y-axis: Behavior score (1-4 scale)
- Line shows daily fluctuations and overall trajectory
- Gaps indicate days without journal entries
What to Look For:
- Overall trend: Generally improving, declining, or stable
- Patterns: Better certain days of week, after specific events
- Volatility: Consistent scores vs. frequent ups and downs
- Outliers: Unusually high or low days (investigate what was different)
Behavior Enhancers
Definition: Hashtags consistently associated with higher-than-average behavior scores
How They're Calculated:
- AI analyzes all journal entries in the time period
- Identifies hashtags that appear when behavior scores are above average
- Ranks by strength of positive correlation and frequency
Examples of Enhancer Categories:
- Activities: Activity hashtags that correlate with higher scores
- People: Specific people present during better behavior periods
- Environments: Locations where your child tends to do well
- Strategies: Intervention methods that prove effective
Using This Information:
- Increase frequency of enhancing activities
- Replicate successful environments in other settings
- Share effective strategies with all village members
- Plan challenging activities after enhancing ones
Behavior Triggers
Definition: Hashtags consistently associated with lower-than-average behavior scores
Examples of Trigger Categories:
- Transitions: Hashtags related to activity or location changes
- Environments: Locations that correlate with challenging behavior
- Physical states: Hashtags related to physical needs or conditions
- Social situations: Social contexts that present challenges
Proactive Strategies:
- Prepare in advance for known triggers
- Develop coping strategies for unavoidable situations
- Modify environments when possible
- Schedule triggering activities when your child is well-regulated
Current and Previous Medications
(If medication data configured)
Current Medications Section:
- Lists active medications with dosages and duration
- Shows average behavior score during current medication period
- Indicates data coverage (percentage of days with journal entries)
- Compares effectiveness to previous medications
Previous Medications Section:
- Historical medication periods
- Enables comparison of current vs. past medication effectiveness
- Helps identify trends and optimal medication combinations
Caregiver Effectiveness
What it shows: Average behavior score when different village members are the primary caregiver
Understanding the Data:
- Based on who recorded the journal entry (primary caregiver for that time)
- Higher scores indicate better outcomes with that caregiver
- Natural variation is normal and doesn't indicate "good" or "bad" caregiving
Factors Affecting Scores:
- Different settings: School vs. home vs. therapy environments
- Different activities: Academic vs. play vs. therapeutic activities
- Time of day: Morning routines vs. evening wind-down
- Child's relationship: Comfort level and familiarity with caregiver
Using This Information Constructively:
- Identify strategies that work well for high-scoring caregivers
- Share successful approaches across the village
- Consider environmental factors, not just caregiver differences
- Use for collaboration, not comparison
Behavior Score by Day of Week
What it shows: Average behavior score for each day of the week, helping you identify your child's weekly patterns
Using Day-of-Week Data:
- Plan intensive activities on days with typically higher scores
- Provide extra support on days with typically lower scores
- Adjust expectations based on your child's weekly patterns
- Share patterns with school and therapy teams for coordinated support
Behavior Goals Analysis
Individual Goal Performance
Separate Analysis: Each behavior goal analyzed independently rather than averaged together
Goal-Specific Insights:
- Average score for this specific goal
- Hashtags that specifically enhance this goal
- Hashtags that specifically trigger challenges with this goal
- Trends over time for this particular behavior
Why Individual Goal Analysis Matters:
- Different activities may impact different goals in different ways
- Environmental factors may help one goal while challenging another
- Understanding goal-specific patterns enables targeted interventions
What's Working vs. What's Not
Goal-Specific Hashtags: Unlike overview enhancers/triggers, these are filtered to show only factors that affect this particular behavior goal
Practical Applications:
- Develop targeted strategies for specific behavioral challenges
- Understand that different goals may need different approaches
- Share goal-specific insights with specialists (ABA therapist focuses on different goals than pediatrician)
Journal Analysis
Entry Summary Statistics
Data Overview:
- Total journal entries in selected time period
- Number of caregivers who contributed
- Unique hashtags generated across all entries
- Total hashtag uses (frequency across all entries)
Filtering by Key Moments
Badge-Based Filtering: View entries by special characteristics identified by AI
Available Filters:
- 🔑 Key Moment: Significant events, breakthroughs, or major challenges
- ❤️ Heartfelt: Emotionally meaningful or touching content
- 😄 Funny: Humorous, joyful, or entertaining moments
- ✅ Effective Strategy: Successful interventions or approaches that worked
- 😍 Cute: Adorable or endearing behaviors and moments
Badge Criteria:
- AI scores each entry on these dimensions (0.0 to 1.0 scale)
- Entries scoring 0.75 or higher receive the corresponding badge
- Multiple badges possible per entry
Using Filtered Views:
- Key Moments: Review for major developments or concerning patterns
- Effective Strategies: Compile successful approaches to share with team
- Heartfelt/Funny/Cute: Revisit positive memories and celebrate progress
- Time-Saving: Focus on most relevant entries rather than reading all
Journal Entry Summaries
Chronological Listing: All entries from the selected time period with key information:
- Entry title (AI-generated summary)
- Date and caregiver who created it
- Overall behavior score
- Visible badges (if any)
- Quick access to full entry details
Hashtag Analysis
Complete Category Breakdown
Comprehensive View: All hashtags organized by their 15+ categories
Expandable Sections:
- Click category headers to expand/collapse sections
- Each category shows all hashtags of that type
- Usage frequency shown in parentheses
- Behavior impact percentage for each hashtag
Category Examples:
- Activities: All activities mentioned across entries
- People: Everyone who appeared in journal entries
- Places: All locations where activities occurred
- Emotions: All emotional states observed
- [All 15+ categories represented]
Hashtag Impact Analysis
For Each Hashtag:
- Usage Count: How many times this hashtag appeared
- Behavior Score: Average behavior score when this hashtag was present
- Impact Percentage: How much above/below average behavior score
- Example: "+20%" means behavior scores were 20% higher than average when this hashtag was present
- Example: "-15%" means behavior scores were 15% lower than average
Using Hashtag Analysis
Identify Patterns:
- Which activities consistently support good behavior
- What environments should be avoided or modified
- Which people or strategies are most effective
- What times or circumstances require extra support
Cross-Reference Categories:
- Strong activity enhancers + effective intervention methods = powerful combinations
- Triggering environments + successful root cause strategies = preparation plans
- People patterns + places patterns = optimal setting arrangements
The Analysis section is most valuable when used regularly to inform decisions about your child's care, environment, and interventions. The insights become more accurate and actionable as you build a larger database of journal entries over time.